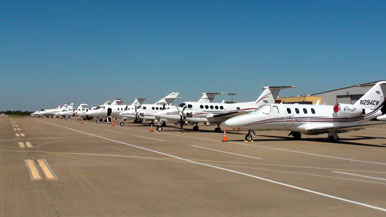
One of the ultimate outputs of the System Plan is the determination of potential locations and types of airport facilities that will be needed to serve North Central Texas through 2035. To accomplish a dependable assessment of the system needs, a comprehensive forecast was derived for the study period.
Forecasting

Methods developed to guide the System Plan provide a nonstandard approach to forecasting regional GA activity. Short-term forecasts support airport planning and personnel requirements; intermediate and long-term forecasts are used to plan major capital investments, including new airports.
The process uses a combination of market share and single variable regression analyses for forecasting the based jet aircraft and a multinomial linear regression for the non-jet based aircraft and the number of airport operations. It is unique to traditional methodologies such as market share, econometric, time series and simulation. To conform to FAA policy, NCTCOG compared the results to two sets of forecast data; the FAA’s Terminal Area Forecasts (TAF) and airport master plans.
Additional considerations in the forecasting process were: airspace, ground access, service area population and employment, fuel prices, pilot population, risk factors and thresholds, NextGen technology, and relationships between based aircraft and operations at various airports.
Forecasting was applied to the following:
- Airside Development Planning. Forecasting indicates future need for airside infrastructure such as length and strength of the runways and taxiways and navigational aids that impact safety and ease of access.
- Landside Development Planning. Facilities influence activity. These include ramp space, fueling facilities, maintenance services and ties, and pilot and passenger amenities.
- Financial Side Planning (Airport Business Planning). Various measures of aviation activity are directly or indirectly tied to the revenues and costs associated with operating an airport. The ability to calculate an anticipated return on investment is a factor in capital investment decisions.
- Community Side Planning. The relationship between an airport and its adjacent communities is important in maintaining the sustainability of the facility and adjacent economic interests.
| Subregional Based Non-Jet Aircraft Forecast | ||||||||||||||||||||
|---|---|---|---|---|---|---|---|---|---|---|---|---|---|---|---|---|---|---|---|---|
| Subregion |
|
|||||||||||||||||||
| North | 1,865 | 2,051 | 2,216 | 2,381 | 2,544 | 2,710 | ||||||||||||||
| South | 541 | 642 | 730 | 818 | 905 | 992 | ||||||||||||||
| East | 238 | 319 | 380 | 440 | 500 | 559 | ||||||||||||||
| West | 288 | 348 | 394 | 440 | 486 | 532 | ||||||||||||||
| Central | 1,314 | 1,436 | 1,567 | 1,700 | 1,832 | 1,963 | ||||||||||||||
| Total | 4,245 | 4,796 | 5,287 | 5,779 | 6,266 | 6,756 | ||||||||||||||
| Subregional Based Jet Aircraft Forecast | ||||||||||||||||||||
|---|---|---|---|---|---|---|---|---|---|---|---|---|---|---|---|---|---|---|---|---|
| Subregion |
|
|||||||||||||||||||
| North | 69 | 82 | 98 | 118 | 141 | 167 | ||||||||||||||
| South | 18 | 22 | 27 | 32 | 39 | 47 | ||||||||||||||
| East | 1 | 2 | 3 | 5 | 8 | 11 | ||||||||||||||
| West | 2 | 3 | 4 | 5 | 7 | 8 | ||||||||||||||
| Central | 288 | 328 | 375 | 428 | 490 | 553 | ||||||||||||||
| Total | 378 | 436 | 507 | 589 | 684 | 787 | ||||||||||||||
| Subregional Local Operations Forecast | ||||||||||||||||||||
|---|---|---|---|---|---|---|---|---|---|---|---|---|---|---|---|---|---|---|---|---|
| Subregion |
|
|||||||||||||||||||
| North | 407,297 | 429,369 | 457,053 | 486,083 | 515,770 | 547,067 | ||||||||||||||
| South | 143,639 | 149,843 | 160,890 | 172,386 | 184,369 | 196,673 | ||||||||||||||
| East | 93,288 | 101,080 | 107,868 | 114,822 | 122,033 | 129,488 | ||||||||||||||
| West | 59,800 | 66,302 | 71,528 | 76,901 | 82,410 | 87,987 | ||||||||||||||
| Central | 264,255 | 279,976 | 303,049 | 327,675 | 353,157 | 379,678 | ||||||||||||||
| Total | 968,279 | 1,026,569 | 1,100,388 | 1,177,867 | 1,257,740 | 1,340,893 | ||||||||||||||
| Subregional Itinerant Operations Forecast | ||||||||||||||||||||
|---|---|---|---|---|---|---|---|---|---|---|---|---|---|---|---|---|---|---|---|---|
| Subregion |
|
|||||||||||||||||||
| North | 241,363 | 255,647 | 273,185 | 292,237 | 312,762 | 334,643 | ||||||||||||||
| South | 92,621 | 96,846 | 103,386 | 110,402 | 117,921 | 125,749 | ||||||||||||||
| East | 55,904 | 59,729 | 63,126 | 67,006 | 70,691 | 74,840 | ||||||||||||||
| West | 36,135 | 39,282 | 42,153 | 45,096 | 48,120 | 51,192 | ||||||||||||||
| Central | 290,504 | 310,052 | 335,005 | 362,668 | 393,234 | 424,781 | ||||||||||||||
| Total | 716,527 | 761,556 | 816,855 | 877,409 | 942,728 | 1,011,206 | ||||||||||||||
Needs Assessment

Three scenarios were developed to explore all feasible options for the purpose of determining airport system capacity. Considerations included current airport capacity, expansion and associated facility costs, projected demands in subregions, and the benefits and risks of public and private airports.
While many privately-owned airports maintain a strong presence and play a vital role in serving capacity needs in the region, they have proven to be historically susceptible to closure throughout the nation, including North Central Texas. Strong pressures, such as urban development, tax increases, and maintenance and facility costs, can cause a privately-owned facility to close. Not federally-obligated to remain open to the public, they may cease operations at any time, leaving aircraft owners looking for a new airport. As such, this study analyzed impacts of such facility losses affecting system capacity in 2035.
Scenario 1(a): A contracted aviation system which assumed that all privately-owned, public-use airports would close and landside expansion was constricted to current property.
Scenario 1(b): A contracted aviation system which assumed that all privately-owned, public-use airports would close with no landside expansion restrictions.
Scenario 2: All facilities remained open to consider the value of privately-owned facilities with no landside expansion restrictions.
Ultimately, the benchmark 2035 facility needs for scenarios became the basis for the recommended developments component of this study. While Scenario 2 showed that the existing system can likely accommodate the 2035 forecasted demand utilizing the current aviation system, examination of the 80 percent capacity levels indicate the need for a new publicly-owned airport and extensive landside development.

